
Over the past few days I read a number of articles from startup founders that said they had to create ?origin statements? to help connect potential customers with the business. Most of these were a load of crap but I realized I wanted to remember why I created DataPrizm in the first place so here goes?
Once I retired from agency life I got heavily involved in affiliate marketing of camera equipment, specifically for underwater photography, and scuba equipment. As I was developing the various topical interest lists to identify things to write about my lists of words and content opportunities soon exceeded what was possible in Excel with its 1 million-row limitation.
Backing up a bit, it was originally called VOCDMS ? for ?Voice of the Consumer Data Management System? which lead to the company name Back Azimuth. The simple goal of VOCDMS was to detail the keywords used but more importantly, why the searcher was using them along a purchase journey. If I could understand their purchase journey, through the searches they used (voice of the consumer), I could write more targeted articles and have higher revenue opportunities.
As I reached the limits of Excel and my powerful desktop, I then built out a database in Microsoft Access and when that did not meet my needs I moved to a web based application. I needed to do more queries and wanted a better UX than I could get in Access and something I could access remote from various dive locations.
Once I got the bulk of the content done and had a solid revenue stream I then went into performance optimization mode. I am a big fan of ?Chasing the Alpha? concept – a well known finance terms for a stock that is exceeding most benchmarks without significant risk. My approach was to try to find anomalies in keyword data or the proverbial “needle in the haystack” With all the data stored it could now be sliced and diced to find under as well as over performing opportunities.
Originally I called my process Keyword Squared or KW4 to represent the four pillars that make up the foundation for keyword management.
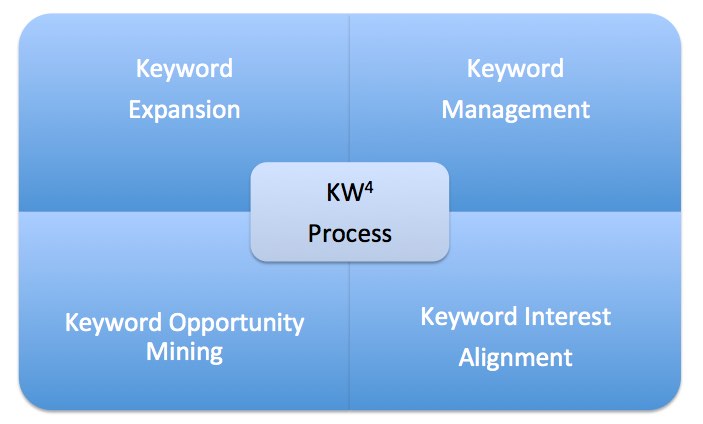
Keyword Research & Expansion – To easily find new keywords and expand existing product keywords sets.
Keyword Management ? To efficiently store and manage keyword inventories preventing duplication of efforts and enable data mining and maximize data sharing.
Keyword Opportunity Mining ? To enable the efficient and ongoing mining of the keyword inventories for anomalies and opportunities.
Keyword Interest Alignment ? To identify, manage and understand the reason why the query was done and catalog differences with device, location, persona and customer journey.
The KW4 model was the basic foundation for the data warehousing and foundation for the mining and reporting that was being build on top that came from the basic question ?Where do I spent my time and can I automate it??
I identified 5 key areas that I focused my time related to keyword insights on a weekly basis. As this is ?opportunity mining? I originally called the report functions “Opportunity Miner” as it would help me find key opportunities that I might overlook with a large volume of data ? again the needle in the haystack.
1. High Ranking/Not Clicked – This report showed the lowest and ripest fruit. The report looks at Tier 1 (critical performance keywords) that are ranking in the top 5 positions in Google but getting less than a 5% share of clicks. Sort of a no brainer right ? these keywords are already ranking well, so no action to improve rank but not getting clicked. The majority of the time it was a snippet change that was needed to increase clicks. As revenue was only generated from AdSense ads on the landing page, every 1% increase in clicks to the page was about a 7% increase in AdSense revenue for those words. So this is where I needed to spend my time when not writing new content.
An offshoot of this report was Rank to Click Ratio – given that I knew that 5% was low I wanted to know what my rate was for different categories of words and buy cycles to see what should be my target click rate. I ultimately added this into the reporting.
2. Opportunity Realized – affectionately known by my clients as the “No Bullshit” or ?KMAE Report” It was hard to monitor what I was achievement by monitoring these words so I needed a report that showed me improvements. This also came from a report that I used to do for clients to show improvement from our efforts.
3. Missed Content Opportunities – since photography is a wide range of products I wanted to find mid-level opportunity where I had no representation. These were mid-tail words like “best lens for macro photography” or even “best zoom lens for safari” these had moderate demand and I did not have any representation. Representation I defined as not having a PLP nor any page ranking in top 30. In most cases a page did not exist so was a good reason to create one.
4. PLP Not Ranking – For each of the high value words I had written content that matched that searchers interest and tried to answer the question and move them to click and more importantly, purchase. I have found that having the right PLP ranking can increase clicks by at least 70% and conversions by 60 to 80% so it was critical that the best page was the page ranking.
5. Keyword Cluster Performance – I wanted to know how much of a set of keywords in a cluster I had ranking and the traffic for the full cluster. For example – underwater Macro Photography – there are 88 words in this cluster with collectively 10k searches a month owning at least 5% of the clicks for all 88 would ensure 500 visits but also that my site was imprinted on their brain as being and expert in the process. I wanted to make sure I had representation for all 88 of these words which represented 100% of the ?searcher continuum? which is the ?first to last search? a customer uses to find, review and purchase a product or service.
My first commercial project was for Sony where we checked to see what share of over 10,000 words in the LCD TV cluster for which they wanted to be found. The more representation in the search results we had the more of the Searcher Continuum they could own and brand awareness, traffic and ultimately sales.
5. URL Analysis – I needed to know, for a specific page, what words were performing both rank but also click rates.
This was all for my use and it worked but did not look great but got me the insights I needed. At a meeting with one of my affiliate partners I showed them what I was doing. They then told a friend and they asked me if I can model their data the same way. During that project the contact ready Search Engine Marketing Inc and some blog posts and wanted me to add in some of those features. He was able to get $50k to fund the integration of the following:
Missed Opportunity Matrix ? this is a report that shows you the search volume you are missing for a set of words. This is one of my signature reports that I have used on nearly every project.
Paid and Organic Co-Optimization ? started as a simple if I have paid and organic at the same time what are they doing?
Proximity Report ? This was created specifically for this client as they were firmly entrenched in the belief that you must buy branded words. We were able to show side-by-side performance for both and saved a lot of money.
Keyword Arbitration ? This was based off a model I built at IBM to support allowing a business unit to have the word. They had a lot of competition across the silos of this business. There were teams focused on travel packages, discounts, home page team etc. We were able to build business unit views and then stack them to see who was actually converting.
Why make it a licensed or commercial product?
Given that I came from an agency and had worked with large complex clients it was only natural that I try to offer the solution directly to companies and agencies. The following are the value propositions I developed when I was considering taking an investment:
1. Identify Immediate Improvement Opportunities – since it takes time to get a project going I assumed if the agency can mine semi-public data they can have a long list of simple items they can fix quickly to get immediate client satisfaction before things get going with major changes. Finding under performing snippets and fixing them is the fastest path to immediate traffic increases.
2. Prioritize Agency staff actions ? At the agency you want to do as little as possible for that maintenance retainer while the client expects continued improvements. As these expectations conflict with each other, the opportunity for limited work and high gain would come from the ability to mine opportunities that needed minimal effort. Using the opportunity Miner reports and my ?30 Minutes to Search Greatness? you can find improvements that show value without a lot of effort.
3. Share Keyword Research ? I naively assumed that efficiency and sharing were two key value propositions for the agency. By dynamically keeping keyword models refreshed and integrating report data you could reduce redundant keyword research and inefficient refreshes. In addition, by sharing keyword data, PLP?s and targets other marketing groups could benefit.
4. Take over paid or organic Projects ? if an SEO or PPC agency is only doing the one service for the client they can potentially win the other by showing the benefits of Co-Optimization through the Co-Op Reporting.
This tool was built on a deep passion for finding and increasing revenue opportunities. It is disappointing that in 2016 more companies are not interested in mining for opportunities and scaling the most fundamental element of search marketing ? the keyword.